
Before the customer journey map, there was the traditional marketing and sales funnel. Marketing and salespeople revered it because it was a simple way to understand how linear customer journeys works. Potential customers entered at the top, buyers trickled out the bottom. Maximize the number that enter at the top, and barring a leak or two, you can increase how many actually convert.
But then came the data boom. And while the funnel still has value as a content strategy tool, these days marketers have far more insight into the customer journey. We know it’s not one straight slide through the funnel. There are an infinite number of ways that customers go about becoming aware of a need, researching alternatives, and ultimately deciding on a solution.
A customer journey map attempts to take all of that data and make it useful for creating strategy. Mapping your business’ unique customer journey can help you focus your strategy, create more relevant content, and ultimately guide more customers to purchase.
Here’s how to create a customer journey map that’s unique to your business and your customers.
More: The Complete Guide To Customer Journey Mapping
How to Create a Customer Journey Map
1. Invite Stakeholders from Across the Organization
Your map will be a valuable document for setting marketing strategy. But creating it shouldn’t be a task confined to the marketing department. Your organization is probably already moving to break down silos, share information between departments, and consolidate data to help shape the customer experience. It’s vital to the future success of the organization to have departments working together toward shared goals.
The customer map project is a perfect opportunity to start bringing other departments to the table. The sales department can share details about interactions with prospects, for example. They can talk about frequently asked questions, referral sources, what causes prospects to bail, and more.
Your customer service department can help with statistics on customer interactions, demographics, common complaints, and more. Even the finance department and HR might have data that helps complete the map. And, of course, it’s a good idea to involve leadership, too. They likely have unique insight into the buying process, and it’s good to get their buy-in early on.
When you involve all your stakeholders, the end result is a more comprehensive view of the customer for everyone, not just the marketing department.
2. Tell a Story
At the heart of it, your map should be a narrative. It tells the story of how a particular type of customer encounters your brand and chooses to make a purchase. As you pull together data, keep the story in mind. This template, called “The Story Spine,” is a good way to keep the narrative front and center:
- Once upon a time, there was a ______
- Every day, _______
- But one day, __________
- Because of that, ________
- Because of that, ________ (repeat)
- Until finally, ________
- Every day after that, _____
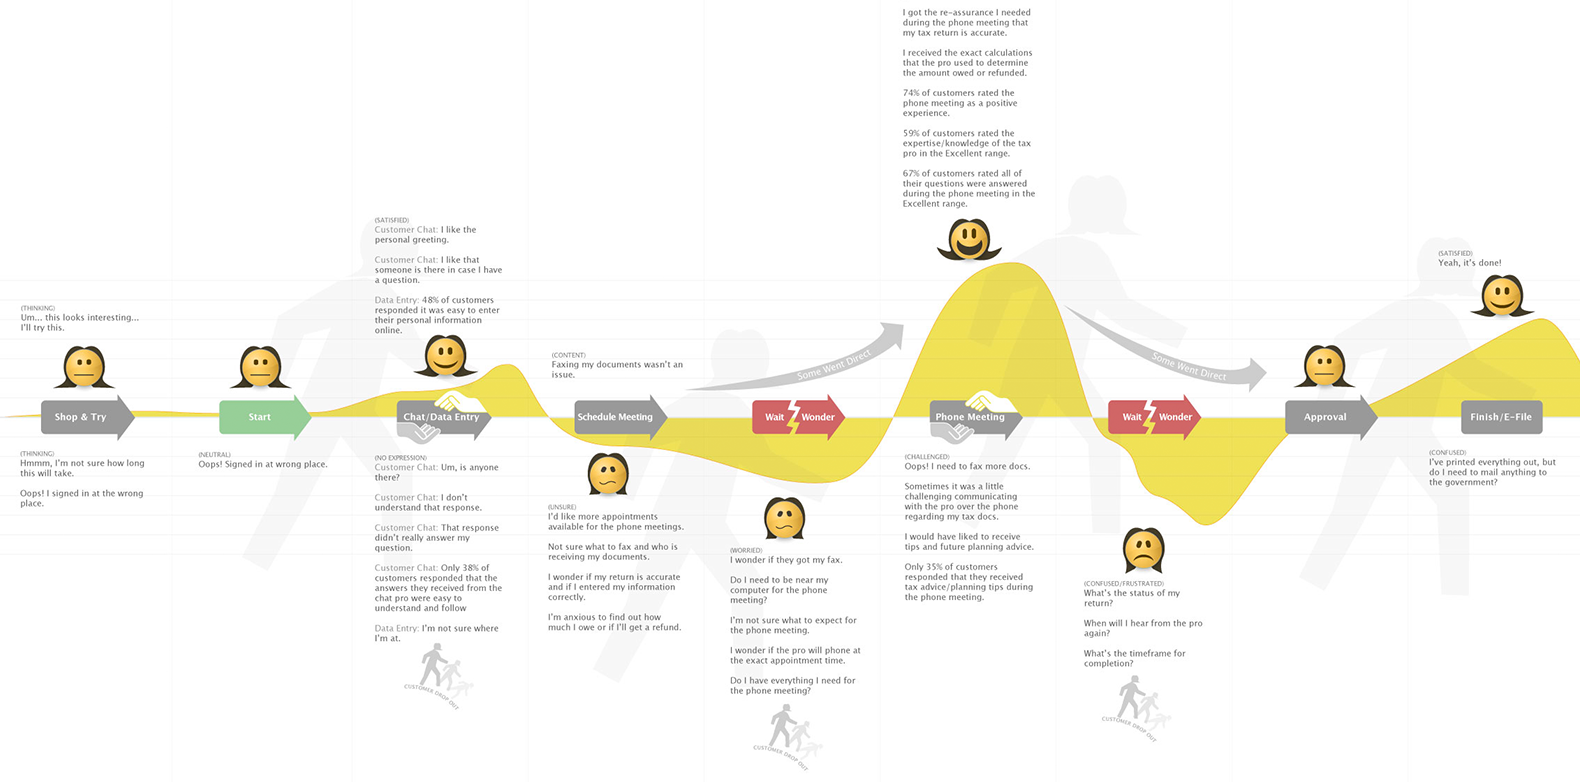
The above customer journey map, created for Intuit, highlights various stages of the customer journey.
Intuit’s map is a great example of applying narrative to the customer journey. It tracks the emotional journey as well as the economic one, using emoji to illustrate customer feelings during each phase. It’s easy to see at a glance when customers might be at risk for dropping out.
3. Keep the Customer Journey Map Simple
As you pull in data and begin to visualize the customer journey, it’s natural to want to capture every single detail. Just remember the goal is to create a useful abstract; an at-a-glance look that hits the key touchpoints.
Don’t get bogged down in minutiae or clutter your map with endless branching paths. Stick to a single narrative. If you find there are too many variations to include in a single customer journey, it’s okay to create more than one map. You can divide your customers by persona and create a simpler map for each. Paring down the information will help you focus—the process of elimination will bring into sharp relief what matters most about your customer journey.
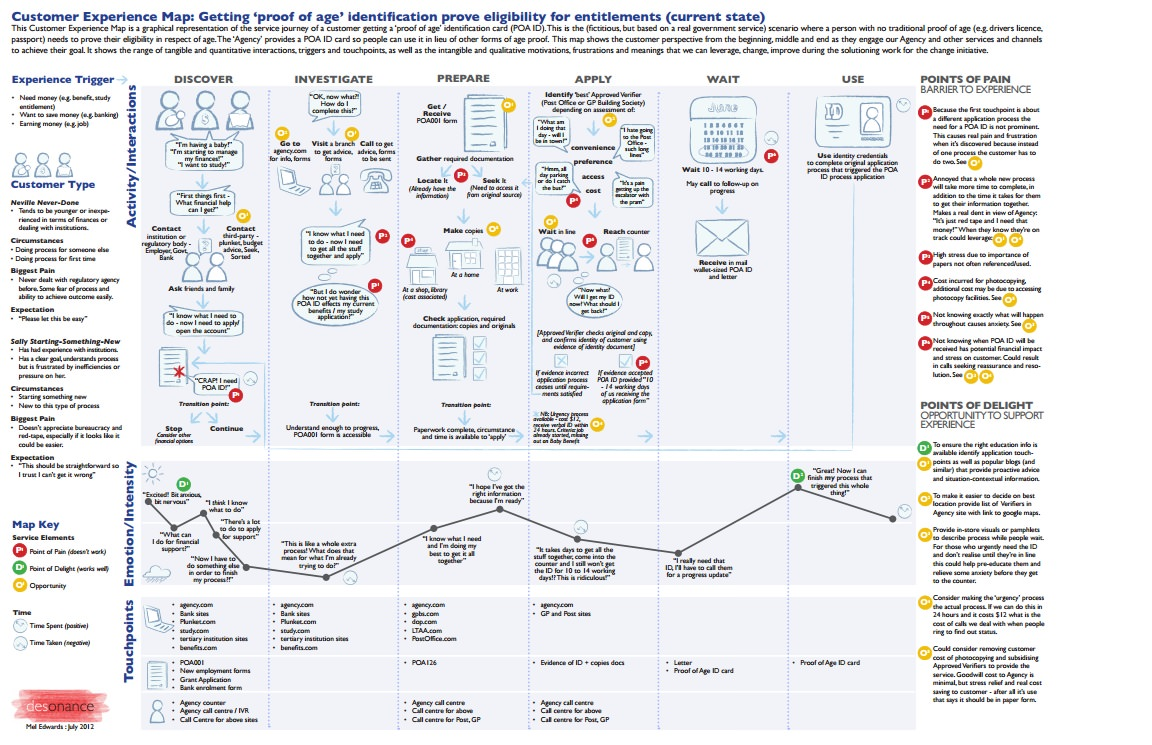
Customer experience maps take many forms. This multi-layered map is jam-packed with information but harder to read at a glance.
For example, compare the Intuit map using emojis to the multi-layered map above. The latter has a great deal more information in it, but it loses the at-a-glance immediacy. It can be hard to tell what the biggest priorities are when there’s so much information on display. It’s worth seeing how simple and effective you can make your map.
4. Focus on Key Touchpoints
Part of keeping your map simple is to only include the crucial moments where marketing can exert influence. Identify opportunities—times the customer has a need that your marketing can meet. But also look at potential risks, points at which the customer could choose to move on without you.
The sales department can be a great help at this stage. They can provide a wealth of anecdotal evidence on what causes prospects to lose interest and how marketing can help bring them back around. That data can help make your map more precise, and also help with sales enablement in the future.
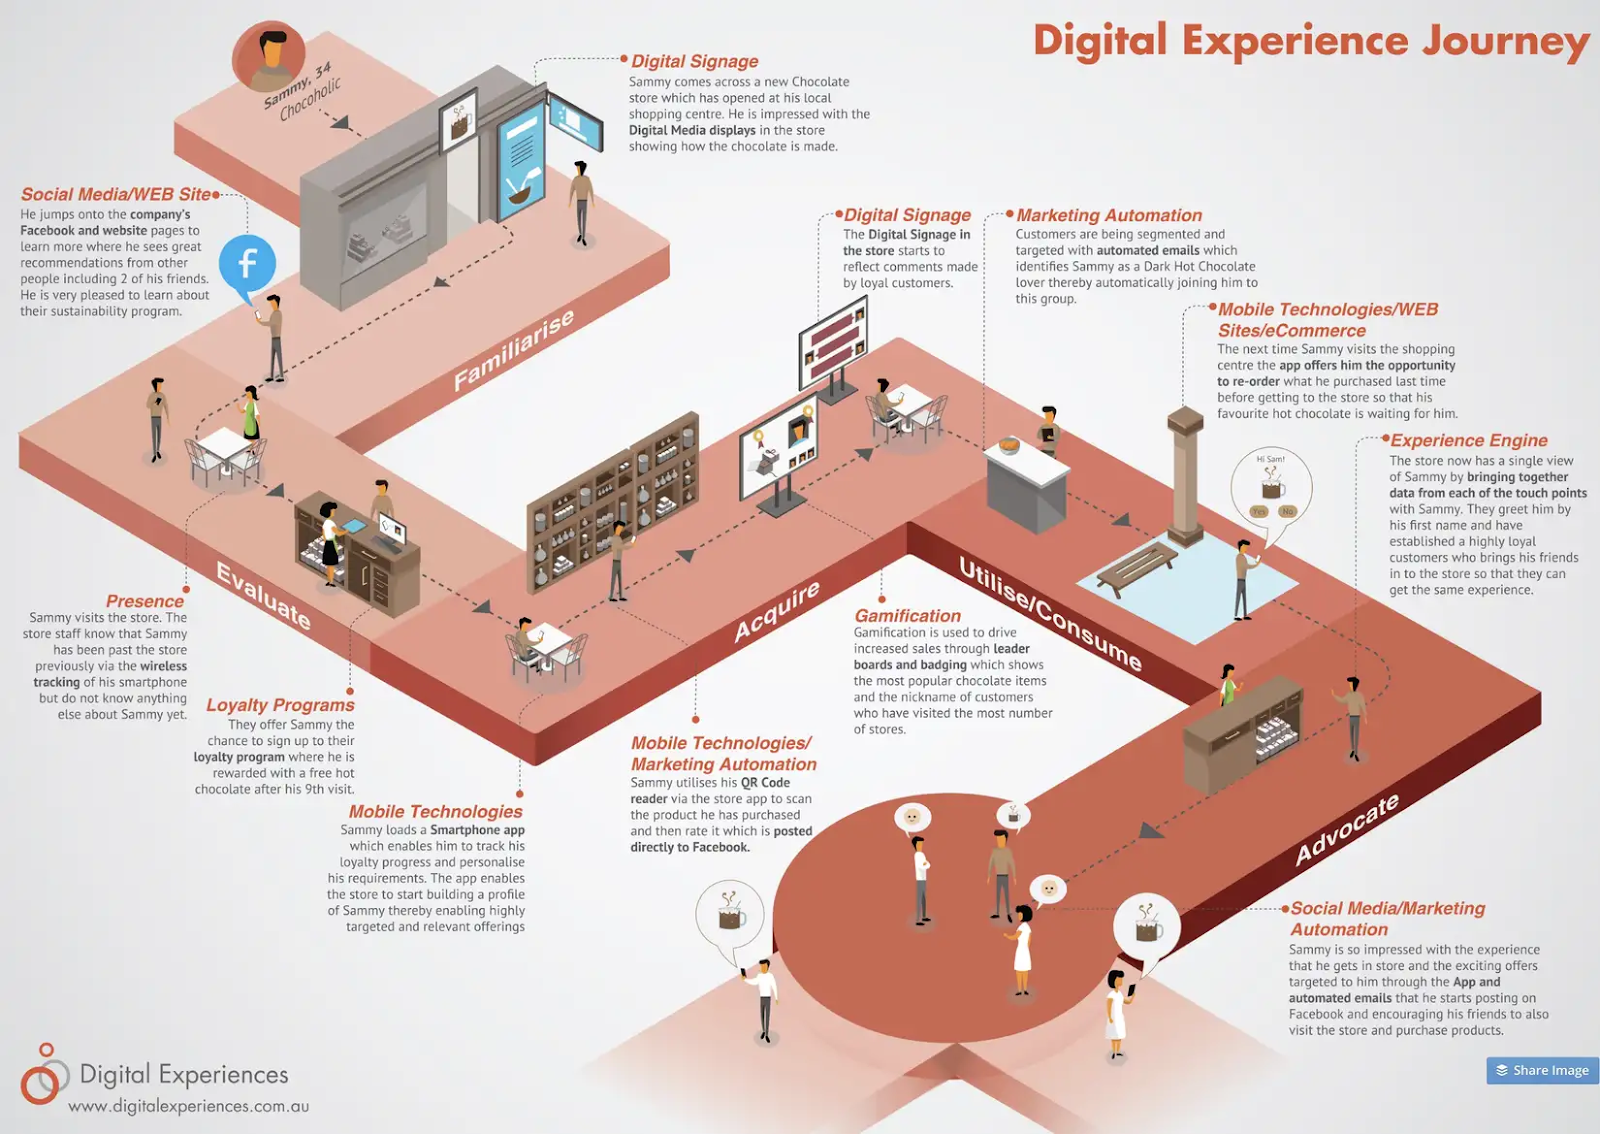
This customer journey map clearly outlines where marketing can have the most impact for this hypothetical hot chocolate shop.
The map from Digital Experiences has an elegant depiction of key touchpoints for a hypothetical hot chocolate store. This map makes it easy to see exactly when there is the greatest opportunity for marketing to make a difference, how different marketing technologies affect consumer choices, and what marketing’s end goal is for the ideal customer.
5. Make It Visual
The goal should be for your map to be as widely seen in the organization as possible. As such, it should be pleasing and rewarding to look at. A well-designed customer journey map is equally at home on a PowerPoint slide and hanging on the wall above your desk.
It’s worth having your design team participate in distilling your data into something both visually appealing and easily understandable. Here are three potential templates to work with:
-
A fully-designed infographic, like the one for the hot chocolate shop above, can convey the information with a creative twist. If you have the design resources, going full visual will help keep the information manageable and consumable.
-
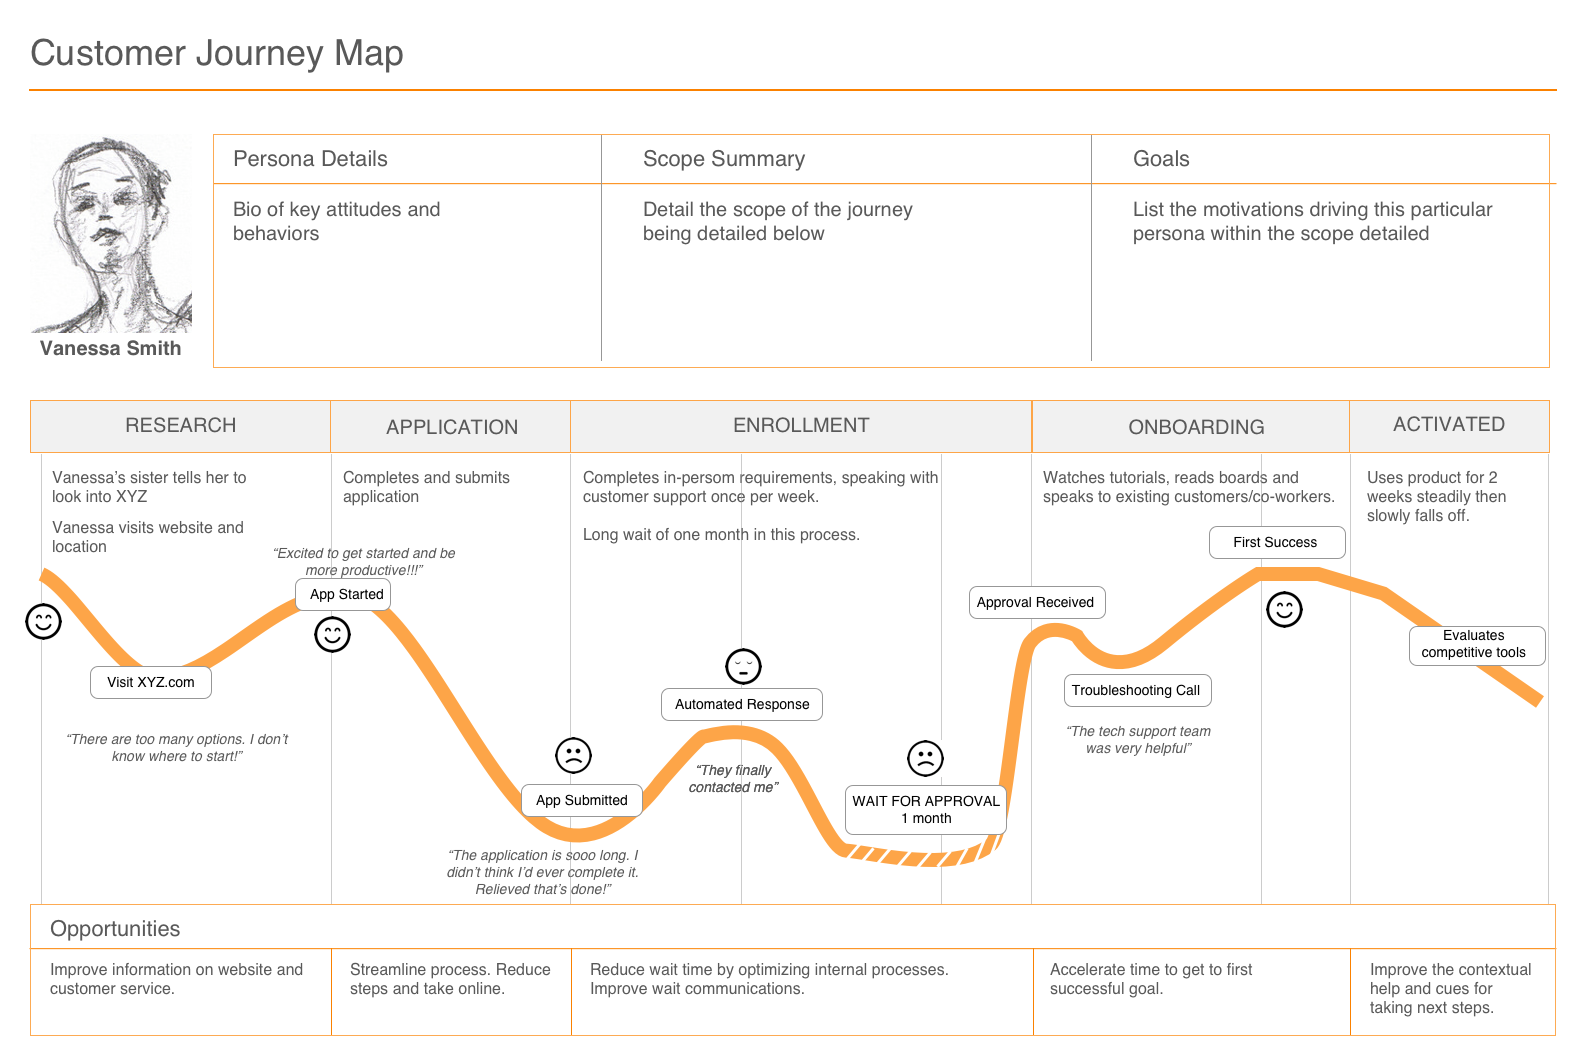
A simple table or graph puts the focus more squarely on the data. It’s a good idea to still add some design flourish for visual interest, though.
-
A grid or flowchart is the most “pure data” version, but it can still be visually appealing (as the example shows).
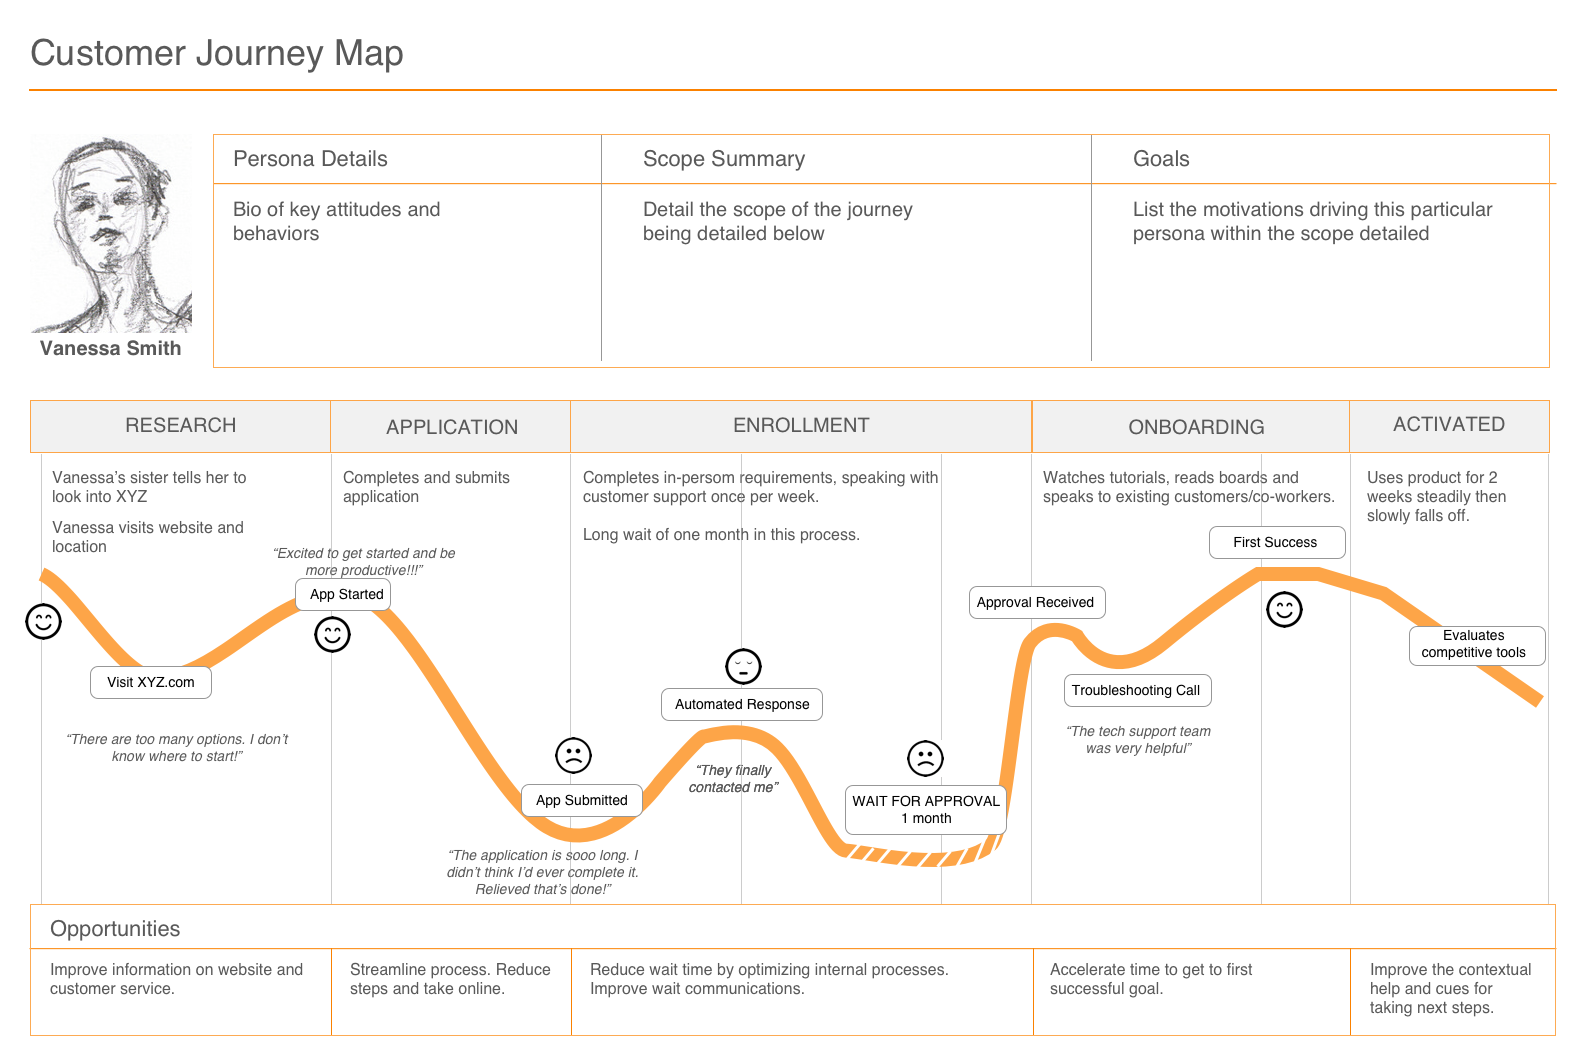
Here is an example of a customer journey map created using a table or graph template.
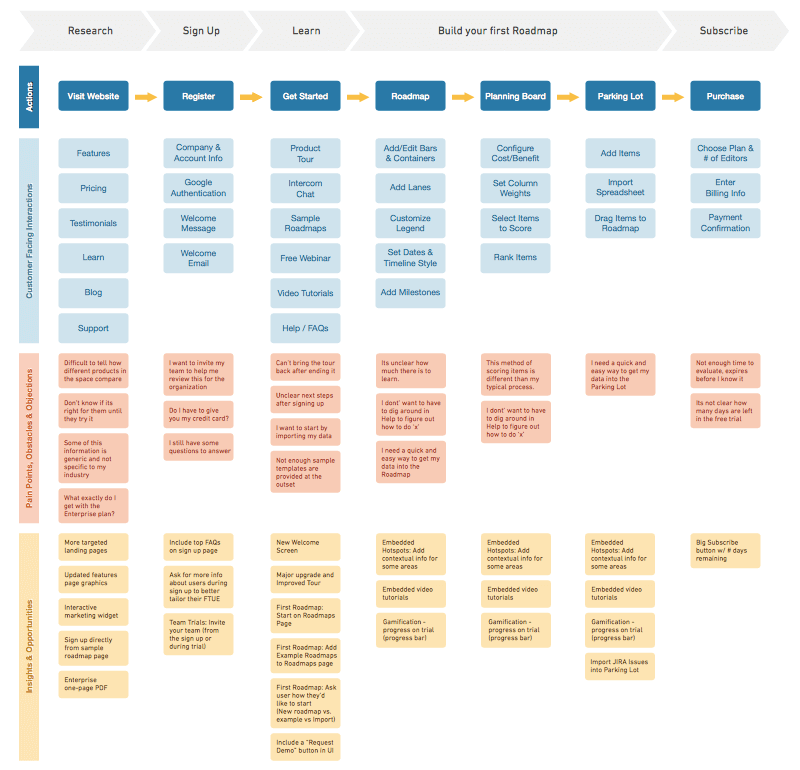
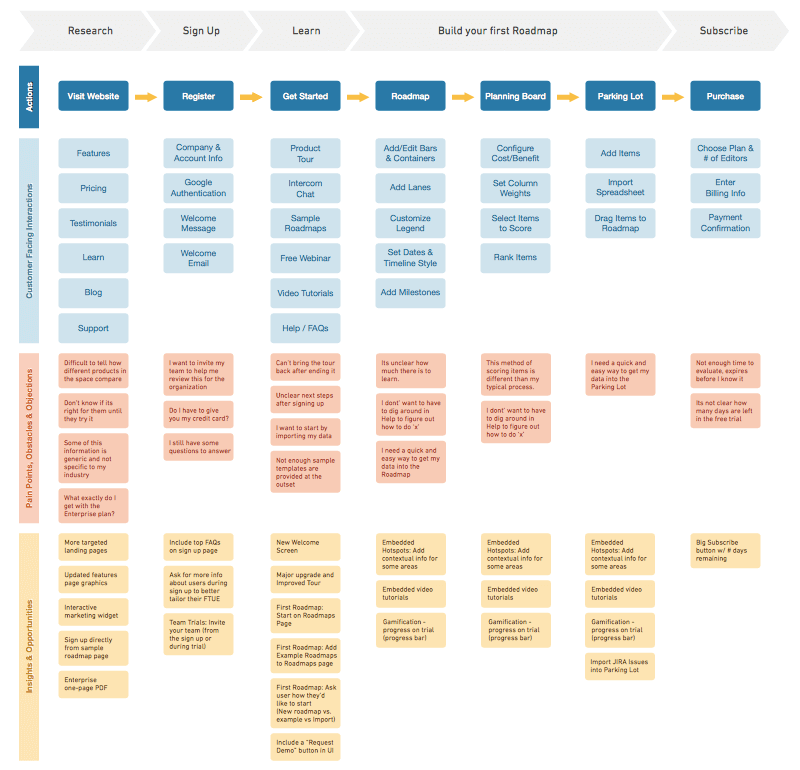
This is an example of how a grid or flowchart can be used to create a customer journey map.
A Good Customer Journey Map Helps You Understand Your Customers
The days when marketers could only do a few things to cause customers to passively fall through the standard-issue marketing funnel are over. Today, marketing journeys take countless shapes, with many diverse touchpoints.
But one thing hasn’t changed: The goal of all your marketing efforts is still to help customers—who come to you through many different media, channels and paths—to realize that your brand is the best solution for a particular problem. A good customized customer journey map will help you understand how your customer searches for a solution. And ultimately, it will enable you to meet the customer wherever they may be, and become a trusted guide for the rest of their journey.
Learn more about customer journey orchestration.
Customer journey map mistakes and how to fix them
Most journey maps fail after the drawing is done, not during it. They describe the path the company wishes customers took rather than the path the data shows customers actually take, and every strategy built on the map inherits that error. The failure modes below do the most damage; each row pairs the mistake with what it looks like in practice and the correction that fixes it.
| Mistake | What it looks like | The fix |
|---|---|---|
| Mapping the ideal path | One clean line from first touch to purchase, with no exits or loops | Pull actual paths from analytics and support logs, and mark where customers stall, circle back, and leave |
| Using internal labels for the stages | Stages named after campaigns or funnel phases only your team recognizes | Rename each stage in the customer’s own words — “figuring out whether this is worth the money,” not “consideration” |
| Stopping the map at purchase | No stages for onboarding, support, renewal, or expansion | Extend the map through the post-purchase stages where retention and referrals are won |
| Collecting pain points with no owner | A visually strong map that has changed nothing a year later | Assign every pain point an owner and a next action, or cut it from the map |
A one-line test catches most of these before they harden into strategy: if you cannot point to the data behind a given arrow on the map, that arrow is an assumption, not an observation. Mark assumptions visibly until evidence replaces them. An unlabeled assumption is the one mistake that survives every review.
Which customer journey map should you build first?
Three formats dominate in practice, and they answer different questions. A current-state map documents how customers move today. A future-state map designs how you want them to move. A day-in-the-life map zooms out to the context around your product — when the need arises and what else competes for the customer’s attention. Choosing the wrong one wastes the mapping effort, so the trade-offs belong in a table:
| Map type | Best for | What it requires | Failure mode | Skip if |
|---|---|---|---|---|
| Current-state | A first map, or finding where today’s customers drop off | Real path data plus input from sales and support | Documenting friction without ranking what to fix first | You can observe almost no customer behavior yet — start with interviews instead |
| Future-state | Redesigning a broken stage or supporting a launch | A validated current-state map underneath it | Designing an idealized path no real customer context supports | Your current-state map is more than a quarter out of date |
| Day-in-the-life | Understanding when and why the need for your product arises | Interviews or diary studies with real customers | Generalizing a few anecdotes into a universal pattern | Your buying cycle is long, considered, and already well documented |
Sequence matters more than the choice itself. Build the current-state map first unless you genuinely cannot: a future-state map built without one redesigns your assumptions rather than your customers’ behavior. There is also a practical signal that current-state work is overdue — when your team cannot agree on where customers drop off today, that disagreement is the agenda for the map, not an argument to settle first.
Keeping a customer journey map current
An accurate map that has gone stale is more dangerous than no map at all, because teams keep making confident decisions from it after the behavior it describes has moved on. The fix is structural rather than motivational: give the map a named owner, a fixed review cadence, and a standing rule that data outranks the drawing.
Each review compares the map against current evidence — path analytics, conversion by stage, win-loss notes from sales, and recent support themes. Where the two agree, leave the map alone. Where they diverge, correct the map first and the strategy second, in that order, so downstream teams are not left executing against a version of the customer that no longer exists. Many teams fold the review into an existing agile cadence rather than inventing a separate ceremony; the ritual matters less than the rule that the map changes when the evidence does.
The review also determines whether the map stays usable by software, not just by people. Personalization programs and agentic customer experience setups act on stage-level assumptions in real time, and an out-of-date map quietly misdirects them; agentic personalization tunes individual interactions against whatever journey model it is given. A current map keeps those systems aimed at the customer your data says you actually have.
FAQ
What is a customer journey map?
A customer journey map is a visual representation of the steps a customer takes when interacting with your brand, from initial awareness through purchase and beyond. It identifies key touchpoints, customer emotions, and opportunities where marketing can influence decisions, helping teams align their strategies around the actual customer experience rather than assumptions.
What should be included in a customer journey map?
A customer journey map should include the key stages of the buying process, critical touchpoints where customers interact with your brand, customer emotions or pain points at each stage, and the marketing channels involved. Keep it simple and focused on a single customer persona rather than trying to capture every possible variation in one map.
How do you use a customer journey map to improve marketing?
Use your customer journey map to identify gaps and drop-off points where customers lose interest or fail to convert, then create targeted content and campaigns to address those moments. By aligning marketing efforts to specific stages of the journey, teams can deliver more relevant messaging, reduce friction, and guide more prospects toward purchase.
How often should you update a customer journey map?
Review it quarterly, and update it off-cycle whenever something changes how customers find and buy from you. Product launches, new channels, pricing changes, and shifts in where your leads originate are the usual triggers. A lighter check is often enough if nothing structural has changed: confirm the stages still match observed behavior, then move on. The map must never become the oldest document in the marketing stack; a stale map misdirects every team that trusts it.
What data do you need to build a customer journey map?
Pull from four sources: behavioral analytics, sales records, support interactions, and direct customer research. Behavioral analytics shows the paths customers actually take. Sales records add objections, referral sources, and the reasons deals die. Support tickets and surveys surface the friction customers feel after purchase. Interviews and win-loss calls explain the why behind the numbers. Triangulating all four keeps the map honest — any single source, used alone, produces a map of what you already believe.